Beyond Scrum and Kanban: Seven Practices for Real-World Efficiency

It’s time to go beyond Scrum and Kanban and explore what drives a culture of effectiveness and impact at Tipalti.


In this post, I’ll lay out seven alternative practices to Scrum and Kanban that any development team can easily integrate into their workflows, regardless of their agile methodology of choice, helping to ensure an effective and healthy development process.

As the title suggests, Scrum and Kanban are the two primary agile methodologies currently dominating the software development landscape.


Both methodologies have been around for some time and have significantly helped shape the reality of modern software development. However, I feel that while these methodologies are effective,  these approaches can leave gaps in creating a more efficient software development lifecycle. The seven practices aim to fill those gaps.

Scrum or Kanban?

Over the years, we’ve had the opportunity to adopt both Scrum and Kanban within Tipalti. Instead of strictly adhering to one methodology, we view them both more as tools in a larger toolkit of practices and approaches to software development.


We understand that different teams at different product maturity levels and business needs require different approaches. The software development teams at Tipalti have the autonomy and flexibility to periodically assess and select the most appropriate tool for the job, whether Scrum, Kanban, or any other agile development methodology.

However, to ensure the effectiveness of all teams, we’ve identified seven methodology-agnostic practices that have proved crucial for an efficient development process. We encourage our teams to practice all of them on top of their chosen methodology.

So, what are these seven practices?
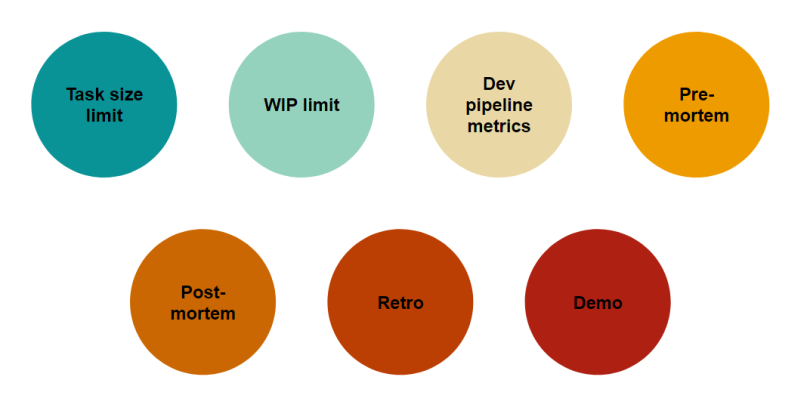
The Seven Practices

1. Task size limit

What’s the Goal: To ensure each development task has a size limit.

Why it’s important: Smaller tasks offer countless benefits: they allow for more flexibility in planning, help encourage continuous delivery, are easier to estimate, are easier to test, and increase motivation—it’s more fun to deliver frequently!

How we’ve implemented it: We set a guideline to limit each development task to five business days, triggering an automatic notification when a task exceeds ten business days in development status.

2. Work in progress (WIP) limit

What’s the goal: For teams to not be working on too many tasks at the same time.

Why it’s important: By ensuring we don’t have too many active tasks on our teams’ plates, we can avoid tasks piling up and clogging the development pipeline. 

If a team brings in more tasks from the backlog than they are completing, it signals a bottleneck. This red flag doesn’t tell us exactly what the issue is, but it’s enough to make us pause and reevaluate.

How we’ve implemented it: Our development pipeline in Jira highlights the board in red when the number of tasks is more than twice the number of developers with an In-Development status, signaling there’s a bottleneck we need to address.

3. Measuring the development pipeline

What’s the goal: To measure key metrics like throughput, cycle times, and task type allocation (how much have we worked on each type of task).

Why it’s important: Having visibility into these metrics allows the team to better identify potential issues or opportunities.

How we’ve implemented it: At Tipalti, we’ve built dashboards in our BI platform on top of our Jira data. This required creating a custom data pipeline. Today, there is a variety of platforms available on the market that can provide this functionality.

4. Pre-mortem

What’s the goal: To conduct a pre-mortem session to help mitigate and prevent risks before going live.

Why it’s important: This might be the most valuable practice on this list and one that is super simple to implement since it can both help you prevent production issues and, in case they do happen, resolve them much faster.

How we’ve implemented it: Before we go live with a big or important deliverable, the team gets together, and we ask ourselves four simple questions: 

  1. When/if this thing breaks, what could have gone wrong? 
  2. How fast can we learn there’s an issue? 
  3. How can we quickly identify the root cause of the problem? 
  4. What could we have done to prevent this from happening in the first place?

It is incredible how effective brainstorming these simple questions can be, helping us save countless—and painful—manhours by implementing mitigations that came up during a pre-mortem session.

5. Post-mortem

What’s the goal: After an incident or when something goes wrong, we conduct a post-mortem session. This lets us transform the lessons learned from the incident into action items to help prevent it from happening again.

Why it’s important: Unfortunately, production incidents are an unavoidable reality. Conducting a quality post-mortem is the best way to uncover the root causes of what happened and help implement action items to prevent the next incident.

How we’ve implemented it: Following an incident, we conduct a session with all relevant stakeholders. It’s important that the session be blameless and that everyone is focused on describing and understanding what happened, analyzing the root causes (I highly recommend using the Five Whys method), and brainstorming follow-up action items.

6. Retrospective

What’s the goal: To analyze our performance as a team and find new ways to improve. The primary focus is on our processes and the software development lifecycle.

Why it’s important: By being mindful and honest about how we all performed as a team, we can continuously find ways to improve and adapt to the current reality.

How we’ve implemented it: This would be the standard retrospective session within the Scrum methodology. For teams not practicing Scrum, I recommend having a retrospective session at least once a month, with the format being a simple roundtable of asking the team: 

  • What worked well? 
  • What could be improved?
  • What are the action items we are taking away from the session? 

7. Demo

What’s the goal: To share your achievements with the team via a short demo.

Why it’s important: Demos are not just a great way to recognize the team by celebrating their achievements but also an opportunity to receive feedback and increase transparency across the organization.

How we’ve implemented it: Similarly to retrospectives, demos are a part of the Scrum methodology. For other methodologies, we usually conduct a demo when we reach a major milestone.

Taking Agile Beyond Industry Norms

Looking at the connecting thread between all of these practices, you’ll notice they are all about continuous improvement.

Whether you’re part of an early startup striving for product-market fit or a large enterprise looking to increase efficiency, implementing these seven practices will not only help your team fill the gaps created by traditional methodologies but will also help you achieve a healthier software development environment.

Do you know any additional practices we should have included here? Let us know in the comments below.

Why measuring experience in years might be a terrible idea

Author: Sergey Bolshchikov | Cross-posted from bolshchikov.net

Experience plays a tremendous role in any professional career and at the end of the day, every employer is looking for the best, usually the most experienced, people. A common way to measure experience is in years. However, I would argue that such an approach might be misleading.

Here I want to offer an alternative approach to evaluating experience and provide some practical questions that you can use to aid your understanding of what experience truly is.

Part 1. The definition.

Let’s start by looking at the definition. According to Merriam-Webster, the experience can be defined as:

a: direct observation of or participation in events as a basis of knowledge

b: the fact or state of having been affected by or gained knowledge through direct observation or participation

Simply, experience is gained from direct observation and/or participation. Therefore, the more we encounter different types of problems and their solutions, the more our experience grows.

Part 2. Real-life.

But what happens in real life? Most of the actions in our daily jobs are so abstract that we just repeat them over and over again. They are usually simplistic tasks, for example, workers at an assembly line, each one doing one part of an overall product but not able to act on the bigger picture. By dividing work into repetitive tasks, the overall business is efficient, but it may hinder attempts to gain broader experience.

What is true for those on industrial assembly lines is true for many software engineers. We are surrounded by infrastructure, libraries, and frameworks that assist us in carrying out complex tasks. This allows us to produce code quickly, and all we are left to do is technical design and its implementation.

Solving new problems and implementing innovative features can be extremely rewarding and stimulate our intellect. Encountering and dealing with the same time of problems can also create a depth of understanding and expertise. However, there is a threshold, that when crossed, means that repeated tasks become mind-numbing and fail to stimulate our creativity. At these times, we need to switch to new challenges. The problem is that many of us are stuck at that repetitive point and count this as additional experience. So while experience measured in time may be growing, experience measured in intellectual growth may have stalled.

Part 3. The valid alternative.

True experience comes from solving different types of problems in a variety of ways.

For example in a set of two candidates, from one perspective you could say that one who has worked for five years has more experience than the other who has worked for three years. However, if we assessed them more qualitatively, we might find that the candidate who has worked for three years has been exposed in that time to a wider diversity of problems.

This is the reason why software engineers who join startups in the early stages are more likely to gain significantly more familiarity with diverse areas while perhaps compromising on knowledge depth as a result.

Part 4. The practical way

I believe it’s fair to say that every position has a finite set of types of problems that one can encounter. For example, one way, but certainly not the only one, to categorize the problems of software engineering would be in the following way, in order of complexity:

  1. Investigating and solving a bug
  2. Implementing a feature within given specifications
  3. Designing and implementing a feature according to a product specification
  4. Architecting the solution across different boundaries (e.g. front-end, back-end, devops)

Thus, if we were evaluating experience in terms of diversity of experience rather than simply quantity of time, we might wish to understand the level of complexity a potential employee has been exposed to. This can be achieved by probing candidates more about the nature of their work experience. From my own experience, I have found that the majority of full-stack developers have experience working with the first and second categories above, while the best candidates have experience in three or more of the categories. I also make sure to ask candidates a more subjective question, asking them to tell me what the most challenging problem they had to face in their career was or the problem-solving process that they are the most proud of. The answers to this question are a good indicator of the edge of a candidate’s experience and in ideal situations, their answers would fall in the third of the fourth category of problem-solving.

Part 5. Conclusion

If you are looking to optimize your professional growth, then seeking out work environments with fast-growth rates can help give you the space to gain a wider diversity of experience. Such places, for example, a startup that grows from hundreds to thousands of users within a short timeframe, is likely to experience many new and complex constraints and problems to solve. Thus, within these environments, you’ll be able to gain not just quantity of experience, but a true depth and range of experience too, which will make you a valuable asset for any company.

Contract testing at a glance

Author: Rotem Kirshenbaum

Testing microservices

Testing is a key ingredient in a successful CI/CD pipeline, especially in the microservices world. We test our classes in unit tests, test business processes in integration tests, even test our UI with visual tests. Our service is tested fully end to end — from frontend JavaScript code to our backend code and database.

However, services aren’t usually a single player in our deployment. Services are often interdependent, either directly by performing http requests to another service or indirectly by sending a message via a message bus.

How do I know that my newly deployed service won’t cause failures in services that depend on it, because I changed my API signature? How do I know that another service I depend on won’t cause my service to fail because now it’s sending a different message?

The simple solution is some form of end-to-end test. Simply deploy your service and its dependencies to a testing environment and run tests to verify that things are still working as expected across the environment.

This is fine when you have a handful of microservices. What happens when you have dozens? Hundreds? Thousands?


This is fine

The dependency chain between services can grow and become an expensive, time consuming and laborious undertaking — I just want to test my service before deployment.

Enter Contract Testing

Contract testing is a testing paradigm that aims to solve this issue. Instead of running expensive end-to-end tests, we define a contract between 2 entities: the consumer and the provider.

A contract describes the interaction between both sides, as a set of requirements that the consumer has from the provider. It’s analogous to interfaces in OOP — The interface is the contract between the calling code (consumer) and the implementing class (provider).

For example, the consumer may declare that when it performs a POST request to a certain endpoint, and that it will receive a response with an ‘OK’ HTTP status and a JSON body:

"consumer": {
    "name": "my-consumer"
  },
  "provider": {
    "name": "my-provider"
  },
  "interactions": [
    {
      "_id": "fd0c3e907b1e128d241810303938b04884b3f242",
      "description": "Get data from provider",
      "request": {
        "method": "POST",
        "path": "/some/path"
      },
      "response": {
        "status": 200,
        "headers": {
          "Content-Type": "application/json"
        },
        "body": true
      }
    }]

The contract can also define that this JSON will contain the fields we require in the correct format and type.

Once we have a contract, both consumer and provider can verify themselves:

  1. The consumer will receive a mocked response based on the contract.
  2. The provider will verify that it can generate the expected response according to a given request.

The important concept to take away from this is that both of these tests occur independently of each other. We test the consumer and provider separately, whenever we need and want, without the need to deploy both of them to a test environment.

This is the power of contract testing!

So how do we actually do it? For that there’s Pact.

What is PACT ?


Baby don’t hurt me, no more

Pact is a contract testing tool; it defines a format for describing a contract (a JSON file) and an API.

On the consumer side, the Pact API will generate a contract based on the consumer requirements from a specific provider and set up a mock http server that returns a result accordingly.

The consumer can then call this HTTP endpoint and verify that it can actually handle the response correctly.

For the provider side, we load the contract file and let Pact perform the HTTP call to the provider service. Pact then verifies that the provider actually returned the correct response based on the contract.

How does the consumer and the provider share the contract between them? 
These are 2 different services that can even reside on different code repos.

For that Pact has another tool in its belt, which is called the Pact Broker. Essentially, this is a repository of contracts; when a consumer generates a contract it publishes it to the broker. A provider then can ask the broker for relevant contracts, using a rest API.

Once a contract succeeded or failed verification, we update it in the pact broker.

The broker serves a very important task — it’s the leading authority on whether or not we can actually deploy a service to an environment. Only the broker knows which versions of services work well with each other.


Pact at Tipalti

So how are we using Pact at Tipalti? How does Pact affect our CI/CD pipeline?

First, there are some things to consider:

  1. Versioning — each consumer / provider in a contract verification is versioned by the git commit id of the relevant code.
  2. Tags — each consumer / provider in a contract verification is tagged with the relevant branch name and any environment it was deployed to (QA, sandbox, production).

This information both allows us to understand the participants of the contract verification and allows us to query the Pact broker.

Let’s take a look at the flow:

Contract tests

The contract tests differ between consumers and providers:

Consumers will verify that they can handle the provider’s response according to that contract.

Providers will query the Pact broker for the relevant consumers and check that the provider responds correctly to each one of their contracts; we search for contracts that are tagged as “prod”, since we want to be sure that we won’t break our production environment with our changes.

These are implemented as unit tests, based on a set of test suites we prepared as part of our testing framework.

Local development / Pull request

Contract tests will run as part of local development and PR tests, the same as any other tests. The results of the contract verification is not published to the Pact broker since the code is not yet part of one of our main development branches.

Post PR

After a PR is completed, we trigger another run of the contract tests on the target branch. 
This time the contract test results are published to the Pact broker and tagged accordingly.

Consumers also trigger running contract tests for all relevant providers that are tagged with “prod”. This verifies the contract on both ends (consumer and provider).

Since these builds run in the background, after the consumer PR, we notify the build results via Slack to the relevant team.

Release pipeline

The first step of the release pipeline is to check if we can deploy the current commit. This is done via the aptly named Pact broker “can-i-deploy” command line.

We run this tool to verify that the commit id (which is also the version of the consumer / provider) can be deployed to the “prod” environment:

pact-broker can-i-deploy --pacticipant "MyServiceName" --version 23jsa45bg --to "prod" additional parameters omitted

If this step succeeds, we can continue in our release pipeline and deploy our service.
On each deployment to an environment we also tag the contract with the name of the environment.

If this step fails, this means that our service has an invalid contract and we can’t continue in our release pipeline — thus achieving our goal of protecting our production environment from failing due to our service.


TL;DR

Contract testing is an important tool in our testing arsenal that allows us to easily verify the interactions between our microservices. We use Pact and Pact broker as our contract testing tools to generate, verify and publish our contract tests.

How to identify a team member that can become a great team leader

Author: Rotem Benjamin

I’ve been working in Tipalti for almost five years. During this time period, we have grown a lot. When I joined, our engineering department had 15 people with three small teams. Today, our engineering department consists of more than 120 great people, with 16 development teams, 4 groups, and counting. That’s a big leap in less than five years.

At Tipalti, we believe in internal promotions. That means, most of our team leads and engineering managers are Tipalti employees that were promoted. That said, it becomes our job to identify the current developers that will become our future managers.

The question is then, who are the people fit to fill this challenging and important role in the organization. How do we know that a good developer will become a good team leader? What indicators can help us predict (no 100% certainty of course) if someone will help coordinate, develop, and motivate other people and make them a team, rather than a group of people?

“What makes a good team leader?”

  • Communicative: compared to a developer, that can be ok while keeping communication to a minimum, a manager has to be in constant communication with multiple roles in the organizations. Whether their direct reporters (developers, QA, etc.), the product team, their manager, and fellow team leads. Communication skills are vital for making a coordinated, motivated, and successful team. The team members can rely on the fact that tasks need to be done, but driving the team is done by explaining why. Aside from what a manager is saying, is how it is being said; A calm manager that puts things into perspective makes the work (and life) of their employees less stressful, more enjoyable, and will improve the atmosphere of the team.
  • Positivity: the team shares the same faith. The team leader, being part of the team, unsurprisingly enjoys and suffers from the same things the team members do. Hence, being positive and not complaining about unpleasant surprises along the way, will make the team follow that behavior. I’m not saying that a manager needs to pretend everything is perfect but to accept the fact the sh*t happens, understand that it’s just part of our lives, and think of it and how it can be avoided next time. A manager always leads by example so the team will follow their behavioral patterns — A positive and committed manager will lead to a positive and committed team.
  • Problem-solving: A team leader will encounter different types of challenges on the way; design problems, resource allocation problems, time-to-market constraints, personal issues with employees, etc. Not all issues have a straightforward solution, some of those issues the manager will face for the first time and some can’t get to a win-win situation. It’s up to the manager to be creative and think out-of-the-box to make the most of what he is faced with. He or she may need to negotiate their way for finding the best solution that will fit the constraints in the problem.
  • Delegating: A manager that does all the work himself can only increase its team capacity up to a certain point. Basically, a manager’s job is to increase its team capacity, and it can be achieved by creating a team in which every person feels the owner of some area. This is done by giving responsibilities to every person in the team, letting them know that it’s up to them to make that area successful. It’s not being out-of-scope and throwing a person into the water, but being more of a guide on that road, rather than the owner.
  • Mentoring: As said, the number one priority of a team leader is to increase the team capacity. Why, again? 5 developers working with an increased capacity of 20%, contribute much more than a team leader that increases its own capacity by 50% (not to mention not all of their time is invested in coding). A constant improvement process of a team member accomplished by doing repeating one-on-ones, tech talks, design sessions will let one grow. Improving the ability to work independently and to solve issues on one’s own, yet always being there to help the person improve by giving constructive feedback and a tip is what makes a leader.
  • Listening: The list of attributes above is here for making an employee better as a developer, a contributor of code, and as a working unit. But the employee is foremost a human being. That said, like everyone, they will have ups and downs, frustrations, celebrations, desires, and aspirations. Being there, to listen, even without saying anything, can mean the world. That is also for getting feedback about yourself without trying to defend yourself or saying something that bothers them about the company’s policy. No, I’m not saying that you should only listen and never talk, but it does say there may be times it’s preferred to do so due to two main reasons: One, nothing is perfect — not even you or your company, and that’s totally fine! Second, being smart is more important than being right, and if someone needs to unburden, not letting him will not do any good.

What indicators should we be looking for in our developers?

The above is nice but…. what does it have to do with developers in your team? How can we tell anything about them if they are not leaders?

It’s true, unfortunately not everything can be checked before someone is promoted. However, there are some key indicators we can look for and may imply on someone that would be a great fit for a future manager.

  • Problem-solvers — that’s easy, everybody is presented with issues on their day-to-day work. The scope may be different, but a problem is a problem, and a creative solution is a creative solution. Look for that in your employees.
  • Team player — there’s no reason to believe that someone who was a solo task force within a team will change ones color and behave differently as a team leader. Someone that can be part of a team and work nicely with others, someone that is always there to help and assist other team members, and do that willingly and calmly, those are a great indication to someone that will help others in a team to the same. In addition, being a team player doesn’t always mean you teach but also learn — a developer that is open-minded and willing to accept other people’s opinions and follow when necessary, regardless of the seniority, is also a great attribute we should be looking for.
  • Communicative and social — This can be seen in different scopes: the team and you. Given the obvious, that we are looking for a person that has great communication skills and can express themselves, we should be seeing someone that updates progress and communicate to you, the manager, when needed and without you needing to ping him. From the team members’ perspective, you should see a person that has good social relations and is widely accepted as a role-less mentor. If someone is neither liked nor accepted by the team, there’s no reason to believe it will be different when the person gets the title to do so.
  • Positivity — A human being that doesn’t complain, looks for the positive side of things and knows how to ignore (or even laugh) the challenging and unpleasant parts of the job. Usually, someone that has a central part in a team supports the atmosphere, in some cases even more than the manager. Look for that quality.
  • Independent — A perfect employee of any manager is someone that works efficiently and independently. Someone that works on a fire-and-forget mode lets you get more time for other tasks without the need to ping him frequently. This kind of virtue is a sign for someone that will probably be able to handle tasks on their own and lead a team that works as a unit without frequent interrupts. It doesn’t mean that there’s no communication; we do expect everyone to raise flags when needed, and to give updates on critical tasks, but not for every small task that should be handled on one’s scope.

All in all, choosing a team lead is a challenging task, but a successful selection may contribute to the organization for many years. The job obviously doesn’t stop there and tutoring never ends, but a nice starting point is always welcomed.

Dockerizing Playwright/E2E Tests


Author: Zachary Leighton | Cross-posted from Medium

Tired of managing your automation test machines? Do you spend every other week updating Chrome versions, or maintain multiple VMs that seem to always be needing system updates? Are you having problems scaling the number of tests you can run per hour, per day?

If so (and perhaps even if not), this guide is for you!

We’re going to eliminate those problems and allow for scalability, flexibility, and isolation in your testing setup.

How are we going to do that you may ask? We’re going to run your test suite inside Docker containers!

#PimpMyDocker

If you haven’t thought about it much, you may wonder why you want to do such a thing.

Well… it all boils down to two things, isolation & scalability.

No, we’re not talking about the 2020’s version of isolation.

We’re talking about isolating your test runs so they can run multiple times, on multiple setups all at the same time.

Maybe you only run a handful of tests today, but in the future you may need to cover dozens of browser & OS combinations fast and at scale.

In this tutorial I’ll attempt to cover the basics of running a typical web application in a Docker container, as well as how to run tests against it in a Docker container using Playwright.

Note that for a true production setup you will want to explore NGINX as a webserver in the container, as well as an orchestration system (like Kubernetes). For a robust CI/CD pipeline also you’d want to run the tests as scripts and have your CI/CD provider run this all in a container with dependencies installed, but more on that later.

You can clone the repo here to have the completed tutorial or you can copy the script blocks as we go along.


The Basics

Creating your app

For this example we’re going to be using the Vue CLI to create our application.

Install the Vue CLI by running the following in your shell:

npm i -g @vue/cli @vue/cli-service-global

Now let’s create the app, here we’ll call it e2e-in-docker-tutorial (but use whatever you like):

vue create e2e-in-docker-tutorial

Follow the on-screen instructions if you want a custom setup, but for this we’ll be using the Default (Vue 3 Preview) option.

After everything finishes installing, let’s make sure it works.

We’ll serve the app locally by running the following:

npm run serve

And open a browser for localhost on the port it chose (http://localhost:8080) and you should see something like this this.

Abba, build me something!

We’ll now write a small sample page that we can use later on to test. It’ll have some basic logic with some interactivity.

For this example we’ll create a dog bone counter, so we can track how many treats Arthur the Cavachon has gotten.

“Is that a dog?” — Arthur

We’ll only have two buttons, “give a bone” and “take a bone” (Schrodinger’s bone is coming in v2).

We’ll also add a message so that he can tell us how he’s feeling. When he is given a bone he will woof in joy, but when you take a bone he will whine in sadness.

And lastly, we’ll keep a counter going so we can track his bone intake (gotta watch the calcium intake you know…).

We’ll write the styles here in BEM with SCSS so we’ll need to add sass and scss-loader to the devDependencies. Note we use version 10 here due to some compatibility issues with the postcss-loader in the Vue CLI.

npm i -D sass sass-loader@^10

The App.vue should look something like this:

<template>
  <Arthur />
</template>

<script>
import Arthur from './components/Arthur.vue'

export default {
  name: 'App',
  components: {
    Arthur
  }
}
</script>

<style>
#app {
  font-family: Avenir, Helvetica, Arial, sans-serif;
  -webkit-font-smoothing: antialiased;
  -moz-osx-font-smoothing: grayscale;
  text-align: center;
  color: #2c3e50;
  margin-top: 60px;
}
</style>

And we also have our Arthur.vue component which looks like this:

<template>
  <div class="arthur">
    <h1>Arthur's Bone Counter</h1>
    <img src="~@/assets/arthur.jpg" class="arthur__img" />
    <h2 id="dog-message">
      {{ dogMessage }}
    </h2>
    <h3 id="bone-count">
      Current bone count: {{ boneCount }}
    </h3>
    <div>
      <button class="arthur__method-button" @click="giveBone" id="give-bone">Give a bone</button>
      <button class="arthur__method-button" @click="takeBone" id="take-bone">Take a bone</button>
    </div>
  </div>
</template>

<script>
export default {
  name: 'Arthur',
  data() {
    return {
      boneCount: 0,
      dogMessage: `I'm waiting...`
    }
  },
  methods: {
    giveBone() {
      this.boneCount++;
      this.dogMessage = 'Woof!';
    },
    takeBone() {
      if (this.boneCount > 0) {
        this.boneCount--;
        this.dogMessage = 'Whine!';
      } else {
        this.dogMessage = `I'm confused!`;
      }
    }
  }
}
</script>

<style lang="scss">
.arthur {
  &__img {
    height: 50vh; // width scales automatically to height when unset
  }
  &__method-button {
    margin: 1rem;
    font-size: 125%;
  }
}
</style>

Once we have that all set up we can run the application and we should see:

Click the “Give a bone” button to give Arthur a bone and he will thank you!

If he doesn’t listen you can also take the bone away, but he’ll be confused if you try to take a bone that isn’t there!

Hosting your built app

In order to host a build we’ll need to add http-server to our devDependencies and create a start script, start by adding http-server:

npm i -D http-server

And add a start script to package.json that will host the dist folder, which is created by running a build, on port 8080:

“start”: “http-server dist -- port 8080”

To test this, run the following commands and then open a browser to http://localhost:8080:

npm run build
npm start

You should see the application running now. Great work! Let’s wrap this all into a Docker container!

I Came, I Saw, I Dockered

Creating a Dockerfile

Now let’s create a Dockerfile that can build the bone counter and serve it up for us.

Create Dockerfile (literally Dockerfile, no extension) in the root of the repo and we’ll base off of the current Alpine Node LTS (14 as of writing this).

We’ll add some code to copy over the files, build the application and run it inside of the Docker container with http-server from our start command.

FROM mhart/alpine-node:14

WORKDIR /app

COPY package.json package-lock.json ./

# If you have native dependencies, you'll need extra tools
# RUN apk add --no-cache make gcc g++ python3

RUN npm ci

COPY . .

RUN npm run build

# Run the npm start command to host the server
CMD ["npm", "start"]

We’ll also add a .dockerignore to make sure we don’t accidentally copy over something we don’t want, such as node_modules, as we’ll install that on the agent.

node_modules
npm-debug.log
dist

Going back to the Dockerfile it’s important to note why we copy over the package* files first, which is because of layer caching.

If we change anything in package.json or package-lock.json Docker will know, and will rebuild from that line downward.

If however, you only changed the application files, it will use the cached version of package.json and its install and will only run the layers where we build and after.

This can significantly save some time when you have large installations, or need to rebuild the image multiple times for larger repos.

Let’s now build the image and tag it as arthur. Make sure you’re in the root directory where the Dockerfile is.

docker build . -t arthur

The output should look something like this:

Once it’s built we’ll run the image we just built and we’ll forward port 8080 on the running container to host port 9000 instead of straight through to 8080 on the host.

docker run -p 9000:8080 arthur

Notice we see in the log that it’s running on port 8080, but this is from inside the container. To view the site we need to go to our host machine on port 9000 that we set using the -p 9000:8080 flag.

Navigate to http://localhost:9000 and you should see the app:

Congratulations! You are now running a web application inside of a Docker container! Grab a celebratory coffee or beer you want before continuing on, I’ll just wait here watching cat videos on Youtube.

Thou Shalt Test Your App

Writing a Playwright test

For the next part, we’ll cover adding Playwright and jest to the project, and we’ll run some tests against the running application. We’ll use jest-playwright which should come with a lot of boilerplate type code to configure Jest and also run the server while testing.

Playwright is a library from Microsoft, with an API almost 1 to 1 with Puppeteer that can run a browser via a standard javascript API.

The big difference is that Puppeteer is limited to chromium-based browsers, but Playwright includes a special WebKit browser runtime which can help cover browser compatibility with Safari.

For your own needs you may want to use Selenium, Cypress.io, Puppeteer, or something else altogether. There are many great automation and end-to-end testing tools in the JavaScript ecosystem so don’t be afraid to try something else out!

So going back to our tutorial, let’s start by adding the devDependencies we need, which are Jest, the preset for Playwright, Playwright itself, and a nice expect library to help us assert conditions.

npm install -D jest jest-playwright-preset playwright expect-playwright

We’ll create a jest.e2e.config.js file at the root of our project and specify the preset along with a testMatch property that will only run the e2e tests. We’ll also set up the expect-playwright assertions here as well.

module.exports = {
  preset: 'jest-playwright-preset',
  setupFilesAfterEnv: ['expect-playwright'],
  testMatch: ['**/*.e2e.js']
};

Please note that this separation by naming doesn’t matter much for this demo project. However, in a real project you’d also have unit tests (you *DO* have unit tests with 100% coverage don’t you…) and you’d want to run the suites separately for performance and other reasons.

We’ll also add a configuration file for jest-playwright so we can run the server before we run the tests. Create a jest-playwright.config.js with the following content.

// jest-playwright.config.js

module.exports = {
    browsers: ['chromium', 'webkit', 'firefox'],
    serverOptions: {
        command: 'npm run start',
        port: 8080,
        usedPortAction: 'kill', // kill any process using port 8080
        waitOnScheme: {
            delay: 1000, // wait 1 second for tcp connect 
        }
    }
}

This configuration file will also automatically start the server for us when we run the e2e test suite, awesome dude!

Writing the tests

Now let’s go ahead and write a quick test scenario, we’ll open up the site and test a few actions and assert they do what we expect (arrange, act, assert!).

Go ahead and create arthur.e2e.js in the __tests__/e2e/ directory (create the directory if not present).

The tests will look like the following:

describe('arthur', () => {
    beforeEach(async () => {
        await page.goto('http://localhost:8080/')
    })

    test('should show the page with buttons and initial state', async () => {
        await expect(page).toHaveText("#dog-message", "I'm waiting...");
        await expect(page).toHaveText("#bone-count", "Current bone count: 0");
    });

    test('should count up and woof when a bone is given', async () => {
        await page.click("#give-bone");
        await expect(page).toHaveText("#dog-message", "Woof!");
        await expect(page).toHaveText("#bone-count", "Current bone count: 1");
        
    });

    test('should count down and whine when a bone is taken', async () => {
        await page.click("#give-bone");
        await page.click("#give-bone");
        // first give 2 bones so we have bones to take!
        await expect(page).toHaveText("#dog-message", "Woof!");
        await expect(page).toHaveText("#bone-count", "Current bone count: 2");


        await page.click("#take-bone");
        
        await expect(page).toHaveText("#dog-message", "Whine!");
        await expect(page).toHaveText("#bone-count", "Current bone count: 1");

    });

    test('should be confused when a bone is taken and the count is zero', async () => {
        // check it's 0 first
        await expect(page).toHaveText("#dog-message", "I'm waiting...");
        await expect(page).toHaveText("#bone-count", "Current bone count: 0");
        
        await page.click("#take-bone");
        
        await expect(page).toHaveText("#dog-message", "I'm confused!");
        await expect(page).toHaveText("#bone-count", "Current bone count: 0");
    });
})

We won’t go into the specifics of the syntax of Playwright in this article, but you should have a basic idea of what the tests above are doing.

If it’s not so clear you can check out the Playwright docs, or try to step through the tests with a debugger.

You might also get some eslint errors in the above file if you are following along and have eslint on VS Code enabled.

You can add eslint-plugin-jest-playwright and use the extends on the recommended setup to lint properly in the e2e directory.

First install the devDependencies eslint-plugin-jest-playwright:

npm i -D eslint-plugin-jest-playwright

Then create an .eslintrc.js file in __tests__/e2e with the following:

module.exports = {
    extends: [
        'plugin:jest-playwright/recommended'
    ]
};

Goodbye red squiggles!

Run tests run!

Now that the tests are set up properly, we’ll go ahead and add a script to run them from the package.json.

Add the test:e2e script as follows:

“test:e2e”: “jest — config jest.e2e.config.js”

This will tell jest to use the e2e config instead of the default for unit tests (jest.config.js).

Now go ahead and run the tests, keep up the great work!

Note that you may need to set up some libraries if you don’t have the right system dependencies. For that please consult the Playwright documentation directly, or just skip ahead to the Docker section which will have everything you need in the container.

Running it in a Docker container

Now we’ll put it all together and run the e2e tests inside a Docker container that’s got all the dependencies we need, which will let us scale easily and also run against a matrix (we don’t touch on this in this article but maybe in a part 2).

Create a Dockerfile.e2e like so:

# Prebuilt MS image
FROM mcr.microsoft.com/playwright:bionic

WORKDIR /app

COPY package.json package-lock.json ./

RUN npm ci

COPY . .

RUN npm run build

# Run the npm run test:e2e command to host the server and run the e2e tests
CMD ["npm", "run", "test:e2e"]

Note that the CMD here is set to run the e2e tests. This is because we want to run the tests as the starting command for the container, not as part of the build process for the container. This isn’t how you’d run with a CI provider necessarily so YMMV.

Go ahead and run the docker build for the container and specify the different tag and Dockerfile:

docker build . -f Dockerfile.e2e -t arthur-e2e

In this demo we build the container with the tests baked in, but in theory you exclude the tests from the COPY command and could mount a volume of the tests so you wouldn’t need to rebuild between test changes.

We can run the container and see the tests with the following command (the --rm flag will remove the container at the end of the test so we don’t leave containers hanging):

docker run --rm arthur-e2e

You should see output like the following:

Great job! You just ran e2e tests in WebKit, Chromium and FireFox in a Docker Container!

If you enjoyed this tutorial and you’d like to participate in an amazing startup that’s looking for great people, head over to Tipalti Careers!

If you’d like to comment, or add some feedback also feel free, we’re always looking to improve!

Migrating from AngularJS to Vue — Part 1

Author: Rotem Benjamin

Here at Tipalti, we have multiple web applications which were written over the course of the past 10 years. The newest of which is an AngularJS application that was born at the beginning of 2014. Back then AngularJS was the most common Javascript framework, and it made sense to start a new application with it. The following is our journey of migrating and rewriting this app from AngularJS to a new VueJS 2 app.

Why Migrate?

Google declared in 2018 that AngularJS is going into support only mode and that will end in 2021. We wouldn’t want our application using a framework without any support. So the sooner we can start migrating the better, as migration can take quite some time.

Why Vue?

As of writing this, there are 3 major players in the front-end framework ecosystem: Angular, React and Vue.
It may appear that for most people migrating from angularJS to Angular is a better idea than a different framework. However, this migration is as complicated as any other migration option, thanks to Google’s total rewriting of the angular framework.

I won’t go into the whole process we underwent until finally deciding to go with Vue, but I’ll share the main reasons we chose to do so. You can find a lot of information on various blogs and tech sites that support these claims.

  • Great performance — Vue is supposed to have better performance than Angular and according to some comparisons better than React as well.
  • Growing community and GitHub commits — It is easy to see on Trends that the Vue community is growing with each passing month and it’s GitHub repo is one of the most active ones.
  • Simplicity — Vue is so easy to learn! Tutorials are short, clear and in a really short time, one can gain enough knowledge needed in order to start writing Vue applications.
  • Similarity to AngularJS — Though it is not a good reason on its own, the similarity to AngularJS makes learning Vue easier.

You can read more reasons in THIS fine post.

What was our status when we started?

It is important to mention that our application was and still is in development, so stopping everything and releasing a new version 6 months (hopefully) later was not an option. We had to take small steps that would allow us to gradually migrate to Vue without losing the ability to develop new features in our application going forward.

During the course of the application development, we followed best practices guides such as John Pappa’s and Todd Motto’s.

The final version of our application was such that:

  • All code was bundled with Webpack.
  • All constant files were AngularJS consts.
  • All model classes were AngularJS Factories.
  • All API calls were made from AngularJS Services.
  • Some of the UI was an HTML with controller related to it (especially for ui-route) and some were written as Components (with the introduction of Component to AngularJS in 1.5 version).
  • Client unit testing was written using Jasmine and Karma.

Can it be done incrementally?

Migrating a large scale application such as the one we have into Vue is a long process. We had to think carefully about the steps we would need to take in order to make it a successful one, that would allow us to write new code in Vue and migrate small portions of the app over time.

As you can understand from the above, our code was tightly coupled to AngularJS, such that in order to migrate to Vue some actions were needed to be made prior to the actual migration — and that was the first part of our migration plan.

It’s important to emphasize that as we started the migration, we understood that although the best practices guides mentioned above are really good, they had made us couple our code to a specific framework without a real need to actually do so.

This is also one of the lessons we learned during our migration — Write as much pure JS code as you possibly can and depend as little as possible on frameworks, as frameworks come and go, and you can easily find yourself trying to migrate again to a new framework in 2–3 years. It seems obvious as that’s what SOLID principles are all about, however it’s sometimes easy to miss those principles when ignoring the framework itself as a dependency.

What were our first steps in the migration plan?

So, the actual action items we created as the preliminary stage of our migration plan were detaching everything possible from AngularJS. Meaning modifying code that has little dependencies, but many others depend on it from AngularJS to ES6 style. By doing so we are detaching it from AngularJS ecosystem. Practically, we transformed shared code to be used by import/export instead of AngularJS built-in dependency injection.

To wrap things up, we created the following action items:

  • Remove all const injection to AngularJS and use export statements. Every new const will be added as an ES6 const and will be used by import-export.
  • Update our httpService (which was an AngularJS service) which is the HTTP request proxy in our app. Every API call in our application was made using this service. We replaced the $http dependency with axios and by doing so created an AngularJS-free httpService. Following that, we removed the injection of httpService from every component in our app and included it with an import system.
  • Create a new testing environment using Chai, Sinon, and Mocha, which allows us to test ES6 classes that are not part of the AngularJS app.
  • Transfer all BL services from AngularJS to pure ES6 classes and remove their dependency from our app.
  • Create a private NPM with shared vue controls what will be used by every application we have. This is not a necessity for the first step to full migration, but it will allow us to reuse components across multiple apps and have them the same behavior and styling (which can be overridden of course), which is something that is expected from different apps in the same organization.

What’s next?

As for our next steps, every new feature will be developed in Vue and will be for now part of the AngularJS app by using ng-vue directive, and at the same time, we can start migrating logical components and pages from AngularJS to Vue by leveraging that same great ng-vue directive.

We did migrate one page to ng-vue and added new tests for the vue components we created, in addition to embedding Vuex that will eventually take control of the state data.
Once we finished all the above, we were ready to take the next step of our migration….
More to follow on the next post.

NodeJS MS-SQL integration testing with Docker/Mocha

Author: Zachary Leighton

Integration testing vs. unit testing

Unit tests are great for testing a function for a specific behavior, if you code right and create your “mocked” dependencies right you can be reasonably assured of your code’s behavior.

But our code doesn’t live in isolation, and we need to make sure all the “parts” are connected and working together in the way we expect. This is where integration tests come in to play.

Charlie Sheen didn’t write unit tests, and look where that got him

A good way to explain the difference would be that a unit test would test that a value (let us say an email for simplicity) passes a test for business logic (possibly a regex or something — maybe checks the URL) and the email and rules would be provided as mocks/stubs/hard-coded in the test, while an integration test of this would check the same logic but also retrieve the rules and value from a database — thus checking all the pieces fit together and work.

If you want more examples or want to read up a bit more on this there are great resources on Medium, as well as Stack Overflow, etc. The rest of this article will assume you are familiar with NodeJS and testing it (here we use Mocha — but feel free to use whatever you like).

Pulling the MS-SQL image

He used Linux containers 🙂

To start you’ll want to pull the Docker image, simply run the command docker pull microsoft/mssql-server-linux:2017-latest (Also if you haven’t installed Docker you might want to do that too 😃)

This might take a few minutes depending on what you have installed in your Docker cache.

After this is done, please make sure to right click, go to “Settings…” and enable: “Expose daemon on tcp://localhost:2375”. As we will see in a few sections this needs to be set to process.env.DOCKER_HOST for the Docker modem to run correctly.

Delaying Mocha for setup

Since we need a few moments to spin up the container and deploy the schema we will use the --delay flag for Mocha.

This adds a global function run() that needs to be called when the setup is done.

You should also use the --exit flag which will kill Mocha after the test run, even if a socket is open.

Preparing the run

In this example, we use the --require flag to require a file before the test run. In this file an IIFE (immediately invoked function expression) is used because we need to call some async functions and await them, and then call the done() function from above. This can be done with callbacks but it is not so clean.

The IIFE should end up looking like this:

(async () => {
    const container = require('./infra/container');
    await container.createAsync();
    await container.initializeDbAsync();
    run(); // this kicks off Mocha
    beforeEach(async () => {
        console.log('Clearing db!');
        await container.clearDatabaseAsync();
    });
    after(async () => {
        console.log('Deleting container!');
        await container.deleteAsync();
    });
})();

Spinning up the container from Node

In the above IIFE we have the method container.createAsync(); which is responsible for setting up the container.

const { Docker } = require('node-docker-api');
const docker = new Docker();
...
async function createAsync() {
    const container = await docker.container.create({
        Image: 'microsoft/mssql-server-linux:2017-latest',
        name: 'mssqltest',
        ExposedPorts: { '1433/tcp': {} },
        HostConfig: {
            PortBindings: {
                '1433/tcp': [{ HostPort: '<EXPOSED_PORT>' }]
            }
        },
        Env: ['SA_PASSWORD=<S00p3rS3cUr3>', 'ACCEPT_EULA=Y']
    });
    console.log('Container built.. starting..');
    await container.start();
    console.log('Container started... waiting for boot...');
    sqlContainer = container;
    await checkSqlBootedAsync();
    console.log('Container booted!');
}

The container is created from the async method docker.container.create , the docker instance needs to have process.env.DOCKER_HOST set, in our case we have a local Docker server running (see: Pulling the MS-SQL image) so we’ll use that.

The options come from the modem dockerode and it uses the Docker API.

After the container spins up we need to check that SQL finished running, our port is <EXPOSED_PORT> and the password is <S00p3rS3cUr3> (these are placeholders so make sure you put something valid).

If you want to read more about what is happening here with the EULA option, etc. check out the guide here from Microsoft.

Since it takes a few seconds for the SQL server to boot up we want to make sure it is running before firing off the test suite. A solution we came up with here was to continually try and connect for 15 seconds every 1/2 second and when it connects, exit.

If it fails to connect within 15 seconds something went wrong and we should investigate further. The masterDb.config options should line up with where you’re hosting Docker and on what port you’re exposing 1433 to the host. Also remember the password you set for sa .

async function checkSqlBootedAsync() {
    const timeout = setTimeout(async () => {
        console.log('Was not able to connect to SQL container in 15000 ms. Exiting..');
        await deleteAndExitAsync();
    }, 15000);
    let connecting = true;
    const mssql = require('mssql');
    console.log('Attempting connection... ');
    while (connecting) {
        try {
            mssql.close();
// don't use await! It doesn't play nice with the loop 
            mssql.connect(masterDb.config).then(() => {
                clearTimeout(timeout);
                connecting = false;
            }).catch();
        }
        catch (e) {
            // sink
        }
        await sleep(500);
    }
    mssql.close();
}

Deploying db schema using Sequelize

Fun Fact: Liam Neeson used Docker to release the Kraken as well.

We can quickly use Sequelize to deploy the schema by using the sync function, then as we will see below it is recommended to set some sort of flag to prevent wiping of a non-test DB.

First though, we want to actually create the db using the master connection. The code will end up looking something like this:

async function initializeDbAsync() {
    const sql = 'CREATE DATABASE [MySuperIntegrationTestDB];';
    await masterDb.queryAsync(sql, {});
    await sequelize.sync();
    return setTestingDbAsync();
}

Safety checks

Let’s face it, if you’ve been programming professionally for any reasonable amount of time — you’ve probably dropped a database or file system.

And if you haven’t go run out and buy a lotto ticket because man you’re lucky.

This is the reason to set up infrastructure for backups and other things of the sort, roadblocks if you will, to prevent human error. While this integration test infrastructure you just finished setting up here is great, there is a chance you may have misconfigured the environment variables, etcetera.

I will propose here one possible solution, but feel free to use your own (or suggest more in the comments!).

Here we will use the SystemConfiguration table and have a key value pair on key TestDB that’s value needs to be truthy for the tables to be truncated. Also at multiple steps I recommend checking the NODE_ENV environment variable to be test which can make sure you didn’t accidentally run this code in a non-test environment.

At the end of the last section we saw the call to setTestingDbAsync the content is as follows:

async function setTestingDbAsync() {
    const configSql =
        "INSERT INTO [SystemConfiguration] ([key], [value]) VALUES (?, '1')";
    return sequelize.query(configSql, {replacements: [systemConfigurations.TestDB]});
}

This sets the value in the database, which we will check for in the next snippit. Here is a snippet of code that will check the existence of a value on the key TestDB (provided from a consts file) that we just set.

const result = await SystemConfiguration.findOne({ where: {key: systemConfigurations.TestDB }});
    if (!result) {
        console.log('Not test environment, missing config key!!!!');
        // bail out and clean up here
    }
// otherwise continue

Wiping the test before each run

Taking the code above and combining it with something to clear the database we come up with the following function:

const useSql = 'USE [MySuperIntegrationTestDB];';

async function clearDatabaseAsync() {
    const result = await SystemConfiguration.findOne({ where: {key: systemConfigurations.TestDB }});
    if (!result || !result.value) {
        console.log('Not test environment, missing config key!!!!');
        await deleteAndExitAsync();
    }
    const clearSql = `${useSql}
       EXEC sp_MSForEachTable 'DISABLE TRIGGER ALL ON ?'
       EXEC sp_MSForEachTable 'ALTER TABLE ? NOCHECK CONSTRAINT ALL'
       EXEC sp_MSForEachTable 'DELETE FROM ?'
       EXEC sp_MSForEachTable 'ALTER TABLE ? CHECK CONSTRAINT ALL'
       EXEC sp_MSForEachTable 'ENABLE TRIGGER ALL ON ?'`;
    await sequelize.query(clearSql);
    return setTestingDbAsync();
}
async function setTestingDbAsync() {
    const configSql = "INSERT INTO [SystemConfiguration] ([key], [value]) VALUES (?, '1')";
    return sequelize.query(configSql, {replacements: [systemConfigurations.TestDB]});
}

This will check for the existence of the value for key TestDB in the SystemConfiguration table before continuing. If it isn’t there it will exit the process.

Now how does this run within the context of Mocha?

If you remember in the IIFE we had a call to beforeEach , this is where you want to have this hook so that you have a clean database for each test.

beforeEach(async () => {
        console.log('Clearing db!');
        await container.clearDatabaseAsync();
    });

Shutdown / Teardown

You don’t want to leave the Docker in an unknown state, so at the end of the run simply kill the container, you’ll want to use force too.

Docker reached out to us and said they don’t use exhaust ports

The after look looks like this:

after(async () => {
        console.log('Deleting container!');
        await container.deleteAsync();
    });

And the code inside container.deleteAsync(); looks like this:

async function deleteAsync() {
    return sqlContainer.delete({ force: true });
}

Putting it all together

Since this article was a bit wordy, and jumped around a bit here are the highlights of what to do to get this to work:

  • Delay Mocha using --delay
  • Require a setup script and use an IIFE to set up the container/DB
  • Spin up a Docker container instance, wait for SQL to boot
  • Deploy the schema using Sequelize and also put in a safety check so we don’t wipe a non-test DB.
  • Hook the wipe logic into the beforeEach hook
  • Hook the teardown logic into the after hook
  • Create amazing codez and test them

I hope you enjoyed this article, and suggestions, comments, corrections and more memes are always welcomed.

Good luck and happy testing!

The Leap from .NET to Linux – Using PM2 with sensitive configurations in production

Authors: Shmulik Biton, Ron Sevet

It’s not very often in the career of a programmer that one has the privilege to deploy a brand new application to production. We were lucky to be in that position. This was even more special since this was a completely new technology stack that we were introducing here at Tipalti. Our entire server-side stack is based on .NET and the various Microsoft products that go along with it. We have an extensive experience with .NET’s best practices, tools, how to run our applications and how to secure them.

This wasn’t the case here. Our new application is written in Node.js and we wanted to run it on Linux for better performance. This meant we had to find how to apply the practices and capabilities from our .NET stack on the Linux stack.

We had two major tasks, the first was to find a capable solution for running our node application. We searched around and found PM2. PM2 is a very comprehensive process manager with many useful features. It’s popular, well maintained and looked very promising.

Securing Configurations

After setting up PM2, we needed a way to secure our sensitive configuration keys like DB credentials and alike. In .NET, you can simply use the Windows Protected Configuration API for a seamless experience. Your web.config is encrypted using the user’s credentials and .NET handles it without too much fuss. You don’t need to store any encryption keys next to the config so it’s a pretty good solution.

In Linux, there isn’t something similar, and after some research, we found a best practice that seemed reasonable to us: storing sensitive configurations as environment variables. The reasoning here is that accessing this file requires either root access or the ability to run code on the machine, which in that point there is not much you can do to keep those variables a secret.

At first, all went well. PM2 performed as expected, and using the environment variables was an easy solution.

The issues started after we had duplicated our server and had to change some of those environment variables. We started getting weird errors that we did not see before. We found out that we were still using the old configurations. Using the `pm2 reload` command did not have any effect. Nor the `restart` command or even restarting the server itself. This was very baffling. It turns out that PM2 was the culprit here. One of PM2’s features forces you to explicitly reload environment variables in order to get the updated values. The flag to use is `–update-env`. This seemed to fix the issues we thought the problems are behind us.

We were wrong. After some time has passed another config change was required and this time the flag did not work. Nothing seemed to work. Rebooting the server did not have any effect either. We figured there must be some sort of a cache PM2 was using to store the application state. This was indeed the case.

We used the command `pm2 save` which creates a dump file on ~./pm2/. When the app started/reloaded/restarted it used that dump file to continue where it left off. This behavior was not desired for two reasons: First, it stopped us from updating our configuration. Secondly, it stored sensitive configurations in the home directory of the user running our app. This can potentially expose us to file traversal attack vectors.

Solving the Issue

We solved it by deleting the dump file and stopped using the `pm2 save` command. We also changed the default startup script PM2 creates when you call `pm2 startup`.

This is our final startup script:

[Unit]
Description=PM2 process manager
Documentation=https://pm2.keymetrics.io/
After=network.target

[Service]
Type=forking
User=
LimitNOFILE=infinity
LimitNPROC=infinity
LimitCORE=infinity
EnvironmentFile=/your/env/file
Environment=PATH=/usr/bin:/bin:/usr/local/sbin:/usr/local/bin:/usr/sbin:/usr/bin
Environment=PM2_HOME=/home/integration/.pm2
PIDFile=/home/integration/.pm2/pm2.pid

ExecStart=/usr/lib/node_modules/pm2/bin/pm2 start /home/integration/.pm2/ecosystem.config.js
ExecStartPost=/usr/lib/node_modules/pm2/bin/pm2 reload /home/integration/.pm2/ecosystem.config.js
ExecReload=/usr/lib/node_modules/pm2/bin/pm2 reload /home/integration/.pm2/ecosystem.config.js --u
ExecStop=/usr/lib/node_modules/pm2/bin/pm2 kill

[Install]
WantedBy=multi-user.target

Note that you need to specify in the startup script the environment file explicitly, otherwise, it won’t load it, and since we are already specifying the file path, we decided to use a dedicated file with root permissions instead of /etc/environment. This would prevent a general process to have access to our configuration.

A quick note on key store solutions: We thought it would add another layer of complexity without adding much security. If someone got root access to the machine they could get the configuration no matter what we do. This is why we decided not to go that route.

In summary

If you want to run a Node.js application under Linux using PM2, these are the steps that we found worked best:

  1. Put sensitive configuration variables in a root accessible file
  2. Do not use the `pm2 save` command
  3. Change the startup script as shown above
  4. Reload your application after changing the configuration using
    `pm2 reload <your config file name> –update-env`

White labeling software UI/UX using LESS

What is White Labeling?

“White Labeling” (also known as “skinning”) is a common UI/UX term used for a product or service that is produced by one company and rebranded by another, giving the appearance that the product or service was created by the marketer (or the company s/he represents). Rebranding has been used with products ranging from food, clothing, vehicles, electronics and all sorts of online wares and services.

For many of Tipalti’s customers, white labeling is key to providing a seamless payment experience for payees such as publishers, affiliates, crowd and sharing economy partners, and resellers. Rather than take a user out of one portal to a third party site and break the communication chain, Tipalti enables the paying company to deeply embed the functionality within their own experience.

How does white labeling work in Tipalti?

Tipalti’s payee portal is fully customizable, allowing our customers to match their corporate brand to every step of the onboarding and management process. For example, entering their contact data, selecting their payment type, completing tax forms, and tracking their invoicing and payment status are all aspects that a payee would need to see and can be presented with the customer’s brand. Customers use their own assets to ensure a seamless look and feel in any payee-facing content.

To support the wide array of branding while maintaining a consistent code-base for all customers, we built the payee portal using LESS.

What is LESS?

CSS preprocessors are a staple in web development. Essentially, CSS pre-processors extend plain CSS into something that looks more like a programming language.

LESS was created in 2009 by Alexis Sellier, also known as @cloudhead, and it has become one of the most popular preprocessors available and has also been widely deployed in numerous front-end frameworks like Bootstrap. It adds to CSS programming traits such as Variables, Functions or Mixins, and Operations, which allows web developers to build modular, scalable, and more maintainable CSS styles.

Click here for more information on how LESS works, syntax and tools.

How LESS is used for white labeling?

Let’s assume you want to use LESS for styling a blog post. Your LESS CSS stylesheet will look something like this:

@post-color: black;
@post-background-color: white;
@sub-post-color: white;
@sub-post-background-color: black;

.post {
	color: @post-color;
	background-color: @post-background-color;
	.sub-post {
		background-color: @sub-post-background-color;
		color: @sub-post-color;
	}
}

With this styling, the blog post will roughly look like this:

less-black

After awhile, let’s say you made contact with a new business partner. The partner wants to display your blog post inside their website, but since the color scheme of the blog post does not match the general style of the partner’s website, they want to create a custom styling that will match their color scheme. This is essentially the process of “white labeling.”

So how do you change the styling to match both color schemes?

This all can be done only in plain CSS, but imagine having to override each CSS class in your blog stylesheet for each theme. Not that attractive, right?

If you are using LESS, the solution is simple. You’ll just override the variables related to each property you are willing to change. The changes are all concentrated in a single location, which makes applying them much easier, faster and less prone to errors.

If your partner prefers the post background color to be blue, you will simply need to do the following:

  1. Create another LESS file
  2. Inside of it add the line “@post-background-color: blue; 
  3. Compile the new LESS file after compiling the original one

That’s all it takes to achieve the wanted layout change. No need to worry that you forgot to update any CSS classes.

less-blue

Complex LESS customizations in Tipalti

For our product, each Tipalti customer can easily customize their own payee portal simply by overriding variables in their own LESS file.

The array of possible customizations reaches far more than colors. For example, our customers are able to change the layout of fieldsets, icons, buttons, elements positions, width/height calculations and more. Because of LESS, the rebranding never interferes with the common code, which is important as there is a lot of intelligence built into our payee portal. Likewise, the customer never has to write any custom code around the logic and execution of the processes. When you’re dealing with something as complex as global payments and validations on payment methods, this is incredibly important.

Here are examples of two very different LESS override stylesheets applied on the same base stylesheet:

less-example-1

less-example-2

Other uses for LESS

LESS is very useful when you’re developing services for customers that feature their brand, but it’s also very clean and efficient for creating a flexible user interface and user experience for your product. For example, when you have many repeated elements that need to be styled, LESS can simplify the effort with variables, operators, and mixins for cross-browser and mobile/responsive support.

Software Testing in Remote Control – Offshoring QA

The term Global Village looked new in the past and came to describe the removal of geographical boundaries, especially in the era of mass media and the Internet. Today it already seems obvious to us that a project (not necessarily in the high-tech industry) might import raw materials from China, use components manufactured in the United States and Germany, and be assembled in Japan. Geographical barriers are already removed for software projects that, for example, accept the requirements from the US product team, develop the software in the UK, and send it to India for testing.

Pro’s and Con’s of Offshore Software Testing

The decision to outsource software testing to an offshore team takes into account several considerations.

The main obstacle in offshore testing is literally, the team being offshore. It’s true, we have communication channels like Skype, and other software, allowing chats in text, audio or video but still, it’s hard to compare to simply walking to the neighboring office or cubicle and actually talking to the tester.

Also, as Agile and Scrum methods are relied on more and more, using an offshore testing team might be a challenge since a stand-up meeting in Skype is just not that intuitive (and sometimes impossible because of the time difference) and integrating the testers might be complex and takes effort and patience.

Another possible issue is language and local culture differences. Most workers do know basic English, but still getting used to reading documents and emails with a lot of grammar mistakes or with phrases you don’t understand can get annoying.

Still, there are some benefits here. Most of the time, development or testing are outsourced because of cost considerations. So, sure, in some countries, the cost for testing or development is less than other countries, but that’s not necessarily the only benefit.

Working with an outsource company, you won’t need to manage the recruitment process, which can be tedious and hard, as the outsource company will take care of that for you.

In addition, for countries like Israel where our development center resides, whose working days are Sunday-Thursday, having a testing team that works on Friday and part of Saturday is a big plus as you can have code ready for testing on Thursday, go for your weekend, and come back next week with the feature already tested.

Some Tips

For conclusion, a few tips for working with offshore testing teams:

  • Make sure there are direct lines of communication between the testing team and everyone else (development and product teams).
  • Make sure you maintain everyday contact with the offshore testing team, like you would do when they are on site.
  • Always make sure the testers are in the loop. They need to stay on top of issues and get updated on every change made during the design and development stages. Make them feel like part of the team and inspire them to work for the good of the project, not just their paycheck.
  • Encourage your offshore team to make suggestions to the work process and the product in general, making sure their voice is heard.
  • The work tasks have to be understood, especially for complex features. One way to try and ensure it is allowing the offshore team to repeat the workflow described in the feature to make sure they got it right.